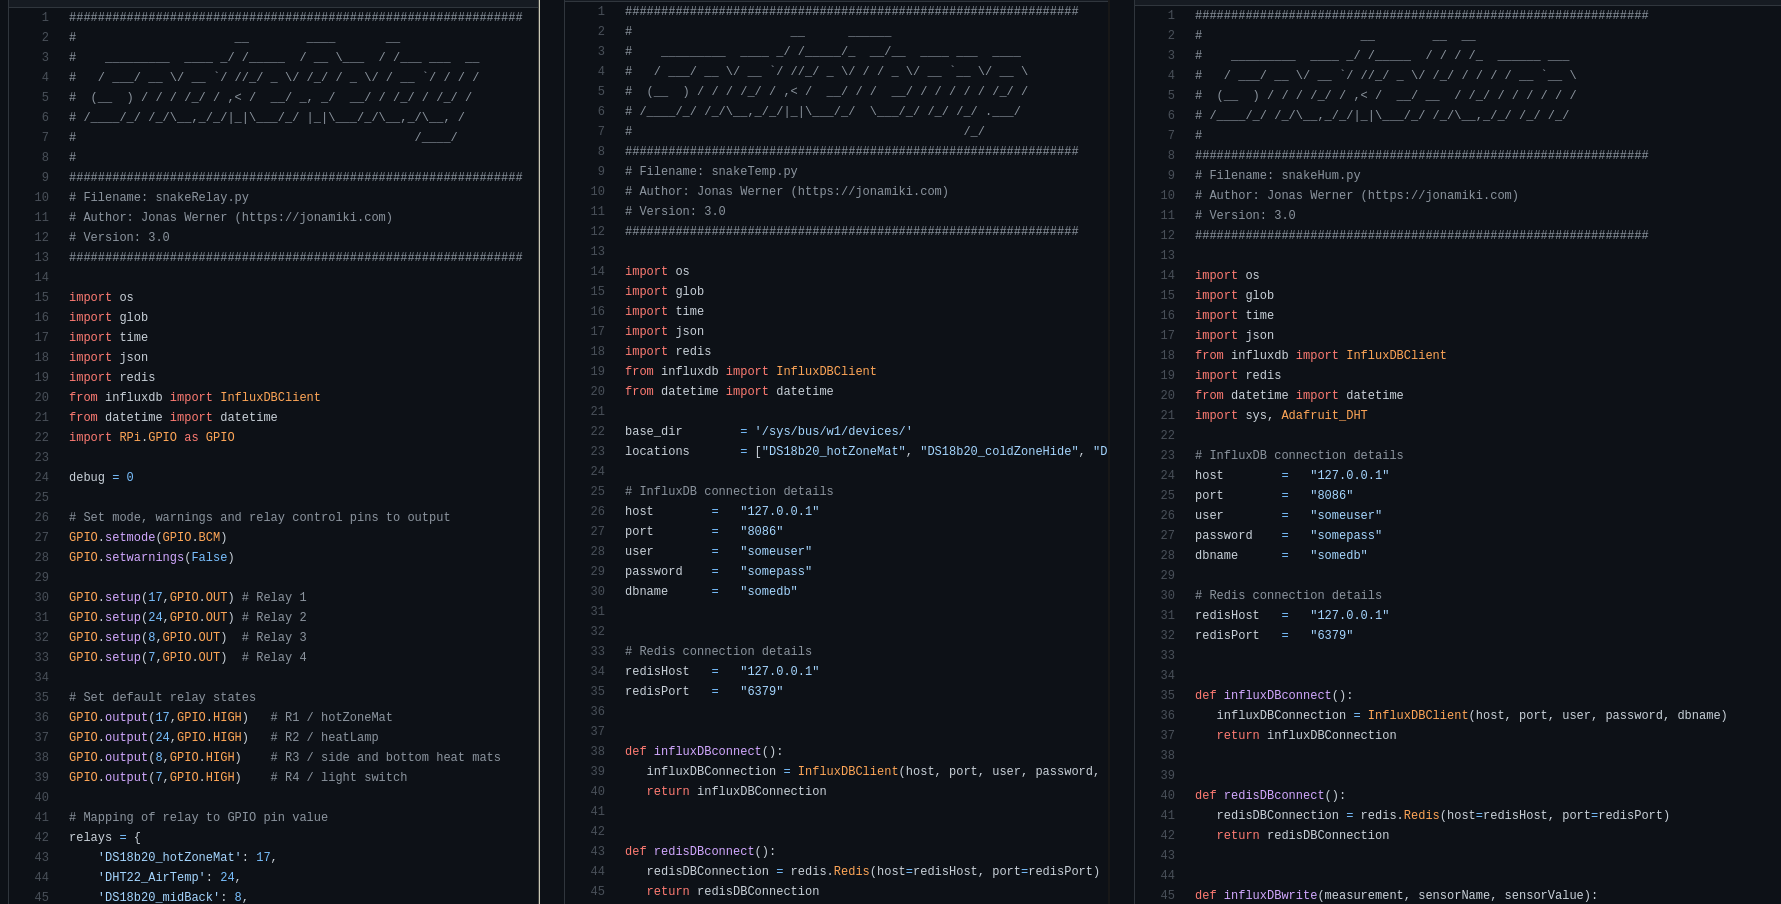
As part of revising the entire environmental control system for the ball python “Mr. Snuggles” I’ve re-done the code for getting sensor telemetry and control of relays for heat mats and the heat lamp from scratch.
Last weekend I finished the updated wiring diagram and soldering. This weekend was the coding update, which will still require some work until it’s done. However, the main modules for DS18b20 sensor telemetry, DHT22 humidity and temperature as well as the actual relay control are done. These files can now be accessed from GitHub as per the below
Next step is to integrate Grafana with buttons for controlling the temperature. This previously required re-building the docker images and was rather inconvenient. Soon it will be as simple as tapping a touch panel. That part will require creating an API which Grafana can interact with and will likely be done next weekend if time allows.
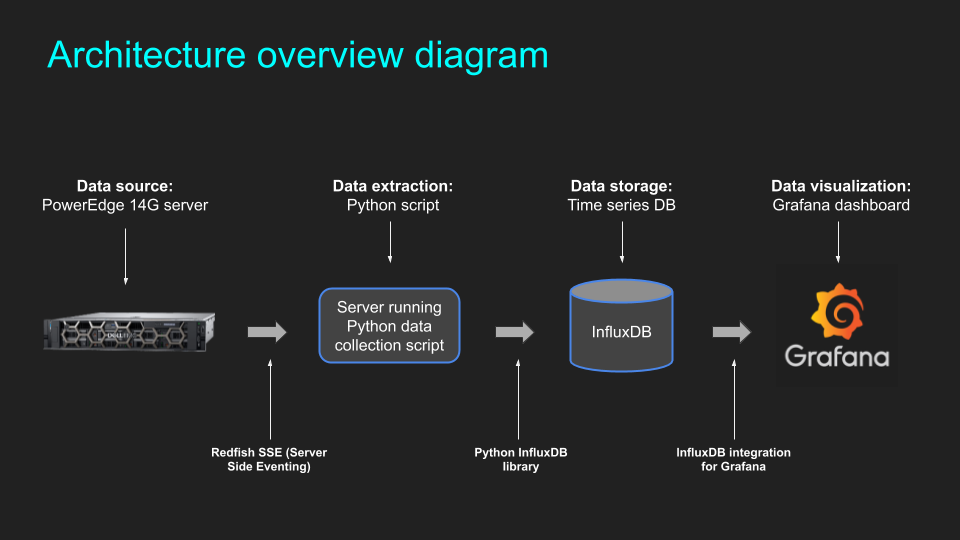
In early 2020 a new feature was added to the PowerEdge 14G servers called “Telemetry Streaming’. This feature makes it possible to send a continuous stream of telemetry containing in-depth information about the state of the server and its various components including, but not limited to, the following:
CPU, Memory and Fans
FPGA and GPU
PCIe slots
Airflow inside server
Power usage information
Since the level and depth of information collected with this method FAR exceeds what has been previously possible using IPMI or other tools, this feature can help in several areas. For example:
Power ML algorithms for Anomaly Detection
Provide detailed inventory, usage and status information
This article contains the practical steps to set up and configure Telemetry Streaming. It assumes it has already been enabled using one of the methods described in the previous article here. In this blog post we use the following:
Update and install:
sudo apt update
sudo apt upgrade -y
sudo apt install python3-venv python3-pip jq -y

Create a virtual environment:
python3 -m venv NAME-OF-ENV
source ./NAME-OF-ENV/bin/activate

Download the repositories from GitHub:
git clone https://github.com/jonas-werner/idrac9-telemetry-streaming.git
git clone https://github.com/dell/iDRAC-Telemetry-Scripting.git

Install the Python modules:
cd idrac9-telemetry-streaming
pip3 install -r requirements.txt

Command for viewing the JSON data:
cat aaa | sed 's/\x27/"/g' | jq
Installing Docker
Installing prerequisite packages:
sudo apt install apt-transport-https ca-certificates curl software-properties-common -y

Adding the key for Docker-CE:
curl -fsSL https://download.docker.com/linux/ubuntu/gpg | sudo apt-key add -

Adding the repository for Docker-CE
sudo add-apt-repository "deb [arch=amd64] https://download.docker.com/linux/ubuntu eoan stable"

Installing Docker-CE
sudo apt update
sudo apt install docker-ce -y

Adding user to docker group:
sudo usermod -aG docker ${USER}
Installation and commands for InfluxDB
Download the container image:
docker pull influxdb

Run the image, create DB and add credentials:
docker run \
-d \
--name influxdb \
-p 8086:8086 \
-e INFLUXDB_DB=telemetry \
-e INFLUXDB_ADMIN_USER=root \
-e INFLUXDB_ADMIN_PASSWORD=pass \
-e INFLUXDB_HTTP_AUTH_ENABLED=true \
influxdb

View data in the container using the "influx" client:
docker exec -it influxdb influx -username root -password pass

Commands for the "influx" client:
show databases
use DB_NAME
show measurements
select * from MEASUREMENT
show field keys from MEASUREMENT
drop measurement MEASUREMENT **DELETES THE DATA**
Downloading and running Grafana
Download the container image:
docker pull grafana/grafana

Run the Grafana instance:
docker run -d --name=grafana -p 3000:3000 grafana/grafana