Gaining insights into the details of what makes up a large and complex VMware environment can be challenging. This is especially true if gathering individual VM performance data is part of the goal.
Live Optics, a tool created by Dell Technologies, is a great way to gather performance data from a vSphere environment over time. It can run on a laptop or VM and has the ability to either take a snapshot of the environment without performance data or to run over a period from 10min to 7 days and report also on performance.
The data can be streamed continuously to a Live Optics endpoint. In this case the data gathering process can be viewed live through the Live Optics web portal. Alternatively the data can be saved locally as an encrypted SIOKIT file during the capture process and then be uploaded to the Live Optics portal once data collection is complete.
Below is a 5 min video showing the entire process of account creation, collection download and report export in Excel format for reference
This post aim to describe three methods with which to enable the Telemetry Streaming feature in the iDRAC9 on Dell EMC 14G PowerEdge servers:
Enable using RACADM / SSH
Enable using provided GitHub scripts
Enable using Redfish and Postman
Enabling using RACADM and Redfish are selective methods while using the GitHub script enables ALL reports in one go. Personally I’d recommend being selective to start with until it is clear what data is required / desired.
Note that enabling everything will result in just shy of 3M data points / 24h / server
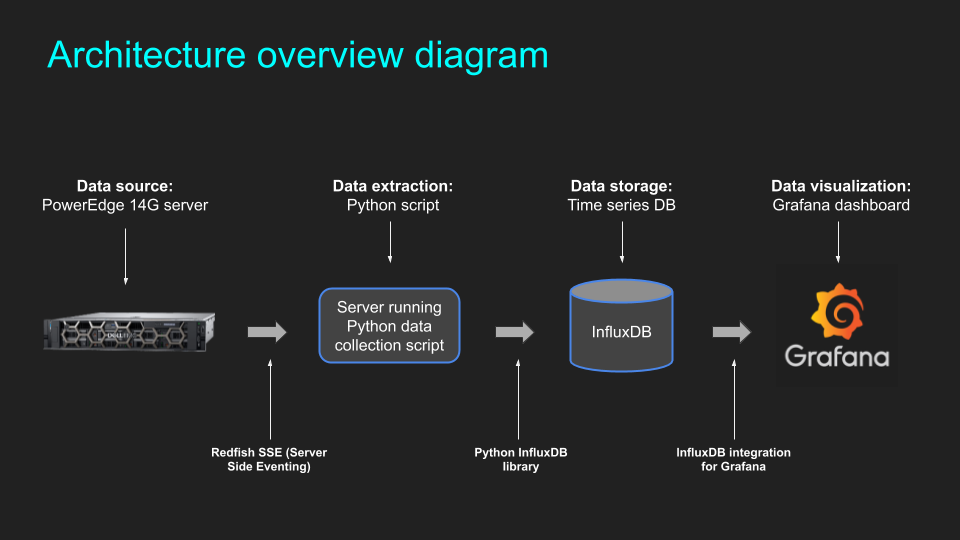
This article contains the practical steps to set up and configure Telemetry Streaming. It assumes it has already been enabled using one of the methods described in the previous article here. In this blog post we use the following:
Update and install:
sudo apt update
sudo apt upgrade -y
sudo apt install python3-venv python3-pip jq -y

Create a virtual environment:
python3 -m venv NAME-OF-ENV
source ./NAME-OF-ENV/bin/activate

Download the repositories from GitHub:
git clone https://github.com/jonas-werner/idrac9-telemetry-streaming.git
git clone https://github.com/dell/iDRAC-Telemetry-Scripting.git

Install the Python modules:
cd idrac9-telemetry-streaming
pip3 install -r requirements.txt

Command for viewing the JSON data:
cat aaa | sed 's/\x27/"/g' | jq
Installing Docker
Installing prerequisite packages:
sudo apt install apt-transport-https ca-certificates curl software-properties-common -y

Adding the key for Docker-CE:
curl -fsSL https://download.docker.com/linux/ubuntu/gpg | sudo apt-key add -

Adding the repository for Docker-CE
sudo add-apt-repository "deb [arch=amd64] https://download.docker.com/linux/ubuntu eoan stable"

Installing Docker-CE
sudo apt update
sudo apt install docker-ce -y

Adding user to docker group:
sudo usermod -aG docker ${USER}
Installation and commands for InfluxDB
Download the container image:
docker pull influxdb

Run the image, create DB and add credentials:
docker run \
-d \
--name influxdb \
-p 8086:8086 \
-e INFLUXDB_DB=telemetry \
-e INFLUXDB_ADMIN_USER=root \
-e INFLUXDB_ADMIN_PASSWORD=pass \
-e INFLUXDB_HTTP_AUTH_ENABLED=true \
influxdb

View data in the container using the "influx" client:
docker exec -it influxdb influx -username root -password pass

Commands for the "influx" client:
show databases
use DB_NAME
show measurements
select * from MEASUREMENT
show field keys from MEASUREMENT
drop measurement MEASUREMENT **DELETES THE DATA**
Downloading and running Grafana
Download the container image:
docker pull grafana/grafana

Run the Grafana instance:
docker run -d --name=grafana -p 3000:3000 grafana/grafana
Automate everything and have more time left for coffee and ridiculously-sized donuts! PowerEdge servers and Ansible automation is a match made in silicon heaven (just ask Kryten!) Included are six videos covering everything from the ground up.
Short demo of EdgeX Foundry using two Raspberry Pi’s. One to generate and send sensor data to EdgeX and another to play the role of an edge device which can receive commands from EdgeX depending on sensor values.
Note: This demo uses the Delhi release since I still haven’t updated the device profile for the “smartVent” Raspberry Pi to work with Edinburgh. I’ll post something cooler once that is working too.