Telemetry Streaming with Dell EMC PowerEdge 14G servers, Python, InfluxDB and Grafana

In early 2020 a new feature was added to the PowerEdge 14G servers called “Telemetry Streaming’. This feature makes it possible to send a continuous stream of telemetry containing in-depth information about the state of the server and its various components including, but not limited to, the following:

  • CPU, Memory and Fans
  • FPGA and GPU
  • PCIe slots
  • Airflow inside server
  • Power usage information

Since the level and depth of information collected with this method FAR exceeds what has been previously possible using IPMI or other tools, this feature can help in several areas. For example:

  • Power ML algorithms for Anomaly Detection
  • Provide detailed inventory, usage and status information
  • Assist with security and auditing

Blog posts in this series

Introductory video and demo

Links to useful documents / scripts published elsewhere:

Configuring Telemetry Streaming

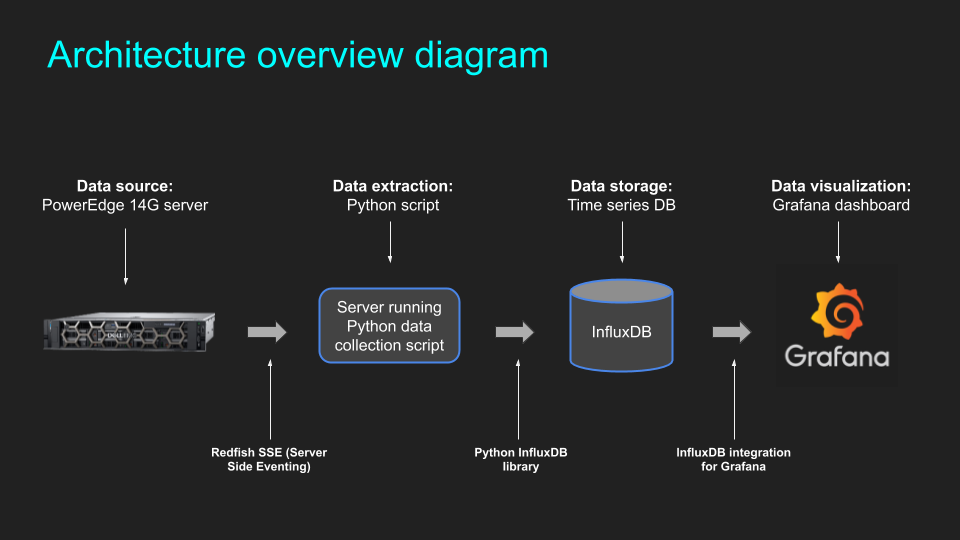
This article contains the practical steps to set up and configure Telemetry Streaming. It assumes it has already been enabled using one of the methods described in the previous article here. In this blog post we use the following:

  • Python script to collect the data
  • InfluxDB for storing the data
  • Grafana for visualizing the data

Blog posts in this series

Overview of the architecture

For the experienced user

Those with experience running containers, installing Python modules, etc., please refer to the below quick start

  • Capture the data from the iDRAC with this Python script: link
  • Run InfluxDB with the following settings: link
  • Create a Grafana instance and connect to InfluxDB to visualize the data

For those who prefer step-by-step instructions

To set this up, start with an Ubuntu server VM. The video below goes through all steps to get started from scratch, including installation of:

  • Python virtual environment
  • Python modules
  • Docker
  • InfluxDB
  • Grafana

Summary of all commands

The commands used below are also summarized in this text file for easy copy & paste: link

URL to get all metrics:

https://IDRAC-IP/redfish/v1/SSE?$filter=EventFormatType%20eq%20MetricReport

Setting up the environment

Update and install: 
sudo apt update
sudo apt upgrade -y
sudo apt install python3-venv python3-pip jq -y

Create a virtual environment:
python3 -m venv NAME-OF-ENV
source ./NAME-OF-ENV/bin/activate

Download the repositories from GitHub:
git clone https://github.com/jonas-werner/idrac9-telemetry-streaming.git
git clone https://github.com/dell/iDRAC-Telemetry-Scripting.git

Install the Python modules:
cd idrac9-telemetry-streaming
pip3 install -r requirements.txt

Command for viewing the JSON data:
cat aaa | sed 's/\x27/"/g' | jq

Installing Docker

Installing prerequisite packages:
sudo apt install apt-transport-https ca-certificates curl software-properties-common -y

Adding the key for Docker-CE:
curl -fsSL https://download.docker.com/linux/ubuntu/gpg | sudo apt-key add -

Adding the repository for Docker-CE
sudo add-apt-repository "deb [arch=amd64] https://download.docker.com/linux/ubuntu eoan stable"

Installing Docker-CE
sudo apt update
sudo apt install docker-ce -y

Adding user to docker group: 
sudo usermod -aG docker ${USER}

Installation and commands for InfluxDB

Download the container image:
docker pull influxdb

Run the image, create DB and add credentials:
docker run \
-d \
--name influxdb \
-p 8086:8086 \
-e INFLUXDB_DB=telemetry \
-e INFLUXDB_ADMIN_USER=root \
-e INFLUXDB_ADMIN_PASSWORD=pass \
-e INFLUXDB_HTTP_AUTH_ENABLED=true \
influxdb

View data in the container using the "influx" client:
docker exec -it influxdb influx -username root -password pass

Commands for the "influx" client:
show databases
use DB_NAME
show measurements
select * from MEASUREMENT
show field keys from MEASUREMENT
drop measurement MEASUREMENT **DELETES THE DATA**

Downloading and running Grafana

Download the container image:
docker pull grafana/grafana

Run the Grafana instance:
docker run -d --name=grafana -p 3000:3000 grafana/grafana

EdgeX Foundry demo

Short demo of EdgeX Foundry using two Raspberry Pi’s. One to generate and send sensor data to EdgeX and another to play the role of an edge device which can receive commands from EdgeX depending on sensor values.

Note: This demo uses the Delhi release since I still haven’t updated the device profile for the “smartVent” Raspberry Pi to work with Edinburgh. I’ll post something cooler once that is working too.