Telemetry Streaming with Dell EMC PowerEdge 14G servers, Python, InfluxDB and Grafana

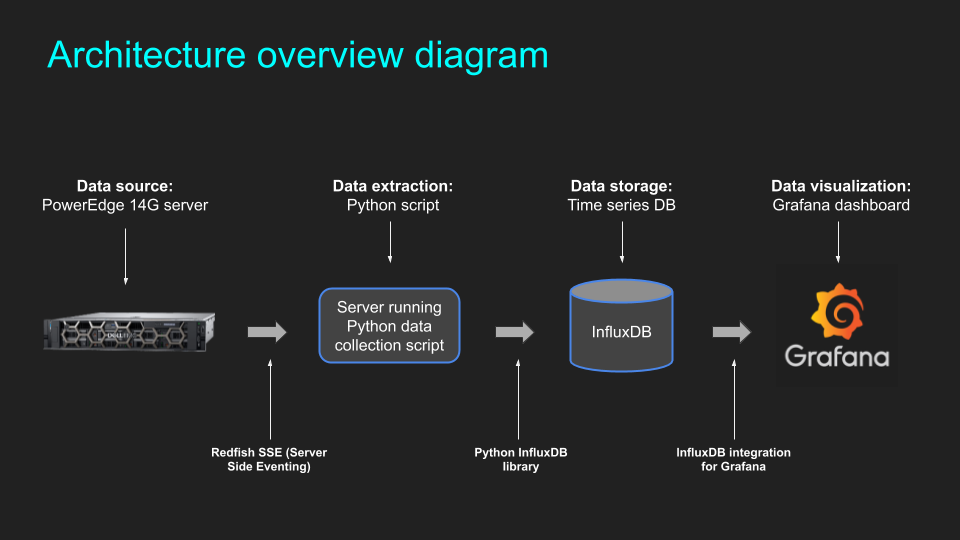
In early 2020 a new feature was added to the PowerEdge 14G servers called “Telemetry Streaming’. This feature makes it possible to send a continuous stream of telemetry containing in-depth information about the state of the server and its various components including, but not limited to, the following:

  • CPU, Memory and Fans
  • FPGA and GPU
  • PCIe slots
  • Airflow inside server
  • Power usage information

Since the level and depth of information collected with this method FAR exceeds what has been previously possible using IPMI or other tools, this feature can help in several areas. For example:

  • Power ML algorithms for Anomaly Detection
  • Provide detailed inventory, usage and status information
  • Assist with security and auditing

Blog posts in this series

Introductory video and demo

Links to useful documents / scripts published elsewhere:

Enable Telemetry Streaming with RACADM, Scripts and/or Redfish and Postman

This post aim to describe three methods with which to enable the Telemetry Streaming feature in the iDRAC9 on Dell EMC 14G PowerEdge servers:

  • Enable using RACADM / SSH
  • Enable using provided GitHub scripts
  • Enable using Redfish and Postman

Enabling using RACADM and Redfish are selective methods while using the GitHub script enables ALL reports in one go. Personally I’d recommend being selective to start with until it is clear what data is required / desired.

Note that enabling everything will result in just shy of 3M data points / 24h / server

Blog posts in this series:

License

Get a 30 day trial of the iDRAC9 Datacenter license here: https://www.dell.com/support/article/en-us/sln309292/idrac-cmc-openmanage-enterprise-openmanage-integration-with-servicenow-and-dpat-trial-licenses?lang=en

Enable using RACADM / SSH

Enable using GitHub script

Enable using Redfish and Postman

URI and payload for Postman

URI:
https://IDRAC_IP/redfish/v1/Managers/iDRAC.Embedded.1/Attributes

Auth: Basic (root / calvin by default)

Methods: 
GET for viewing current settings
PATCH for changing settings

Payload for enabling streaming telemetry (indentation doesn't work properly in Wordpress, sorry):
{
"Attributes": {
"Telemetry.1.EnableTelemetry": "Enabled"
}
}

Payload for enabling / disabling reports (indentation doesn't work properly in Wordpress, sorry)
{
"Attributes": {
"TelemetryCPUSensor.1.EnableTelemetry": "Enabled",
"TelemetryPowerStatistics.1.EnableTelemetry": "Disabled",
"TelemetrySensor.1.EnableTelemetry": "Enabled"
}
}

Configuring Telemetry Streaming

This article contains the practical steps to set up and configure Telemetry Streaming. It assumes it has already been enabled using one of the methods described in the previous article here. In this blog post we use the following:

  • Python script to collect the data
  • InfluxDB for storing the data
  • Grafana for visualizing the data

Blog posts in this series

Overview of the architecture

For the experienced user

Those with experience running containers, installing Python modules, etc., please refer to the below quick start

  • Capture the data from the iDRAC with this Python script: link
  • Run InfluxDB with the following settings: link
  • Create a Grafana instance and connect to InfluxDB to visualize the data

For those who prefer step-by-step instructions

To set this up, start with an Ubuntu server VM. The video below goes through all steps to get started from scratch, including installation of:

  • Python virtual environment
  • Python modules
  • Docker
  • InfluxDB
  • Grafana

Summary of all commands

The commands used below are also summarized in this text file for easy copy & paste: link

URL to get all metrics:

https://IDRAC-IP/redfish/v1/SSE?$filter=EventFormatType%20eq%20MetricReport

Setting up the environment

Update and install: 
sudo apt update
sudo apt upgrade -y
sudo apt install python3-venv python3-pip jq -y

Create a virtual environment:
python3 -m venv NAME-OF-ENV
source ./NAME-OF-ENV/bin/activate

Download the repositories from GitHub:
git clone https://github.com/jonas-werner/idrac9-telemetry-streaming.git
git clone https://github.com/dell/iDRAC-Telemetry-Scripting.git

Install the Python modules:
cd idrac9-telemetry-streaming
pip3 install -r requirements.txt

Command for viewing the JSON data:
cat aaa | sed 's/\x27/"/g' | jq

Installing Docker

Installing prerequisite packages:
sudo apt install apt-transport-https ca-certificates curl software-properties-common -y

Adding the key for Docker-CE:
curl -fsSL https://download.docker.com/linux/ubuntu/gpg | sudo apt-key add -

Adding the repository for Docker-CE
sudo add-apt-repository "deb [arch=amd64] https://download.docker.com/linux/ubuntu eoan stable"

Installing Docker-CE
sudo apt update
sudo apt install docker-ce -y

Adding user to docker group: 
sudo usermod -aG docker ${USER}

Installation and commands for InfluxDB

Download the container image:
docker pull influxdb

Run the image, create DB and add credentials:
docker run \
-d \
--name influxdb \
-p 8086:8086 \
-e INFLUXDB_DB=telemetry \
-e INFLUXDB_ADMIN_USER=root \
-e INFLUXDB_ADMIN_PASSWORD=pass \
-e INFLUXDB_HTTP_AUTH_ENABLED=true \
influxdb

View data in the container using the "influx" client:
docker exec -it influxdb influx -username root -password pass

Commands for the "influx" client:
show databases
use DB_NAME
show measurements
select * from MEASUREMENT
show field keys from MEASUREMENT
drop measurement MEASUREMENT **DELETES THE DATA**

Downloading and running Grafana

Download the container image:
docker pull grafana/grafana

Run the Grafana instance:
docker run -d --name=grafana -p 3000:3000 grafana/grafana

NoOps: Fully automated self-service with ServiceNow, Jenkins and Ansible with Dell EMC PowerEdge servers

Moving from IT services Hell to Nirvana

Many organizations are struggling to keep up with the evolution IT is going through. Operations teams have to cover more ground than before and have to get used to manage complex workloads across multiple clouds as well as their own data centers and edge locations.

At the same time users are getting accustomed to the high service levels offered by the hyper-scalers like AWS, Azure and GCP where any request for IT infrastructure is fulfilled in seconds or minutes. Those are high standards for the local Ops team to live up to. Furthermore, if the lack of speed in fulfilling those requests when done to internal IT hold up development teams and thereby threaten to stall the business itself we have a real problem on our hands. How can this be solved in an efficient and and economical manner? 

Changing the game by automating the pipeline

Enter NoOps, or IT operations where automation fulfill the requests for IT services without the local Ops team having to get involved. This keeps the requesting user happy, the team that needs the services on schedule and the business itself on track. At the same time the Ops team can focus on more urgent tasks, like how to leverage IT to empower the business without having to struggle with keeping up with service requests from users. 

These IT changes can be anything from bare metal server changes to entire clusters including server, network, storage and virtualization or container orchestration layers.

Scope

In this example we showcase how the tools listed below can be linked together to work as a user-initiated pipeline to change to a hardware setting. In this case we update a server NTP value, but anything is possible – including complex IT stacks

  • ServiceNow: User portal, approval flow, chargeback
  • ServiceNow MID Server: On-prem SNOW instance to traverse firewalls
  • Jenkins: Manages the CI/CD pipelines, the integration and orchestration of other tools, like Ansible
  • Ansible: Does the actual legwork in the execution of playbooks for set tasks. It accepts variables from the user passed in via Jenkins from ServiceNow
  • Dell EMC PowerEdge server: Used as the target of the automation framework in this use case

Architecture

Overall architecture from user to device

The moving parts of ServiceNow

What is out of scope and complementary guides

The guide doesn’t go through the setup of the individual solutions but the steps are described in great detail below:

ServiceNow Workflow script

ServiceNow Workflow script to capture the variable entered by the user:

var ntp1 = workflow.inputs.ntp1;

Finally, the YouTube video 🙂

Ansible with Dell PowerEdge servers

Automate everything and have more time left for coffee and ridiculously-sized donuts! PowerEdge servers and Ansible automation is a match made in silicon heaven (just ask Kryten!) Included are six videos covering everything from the ground up.

Installation steps for Ansible

To be used with the first video: The installation steps for Ansible as well as the OpenManage modules for PowerEdge can be downloaded from here: link